2,500 bottles stranded on the shore
By AJ McConville, Thames River Watch Programme Coordinator
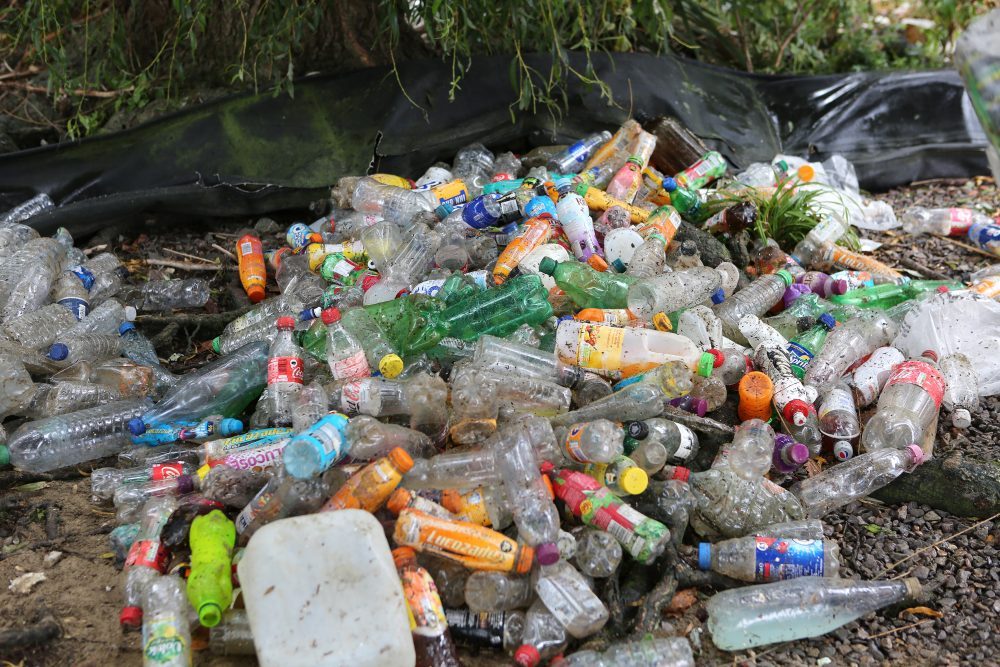
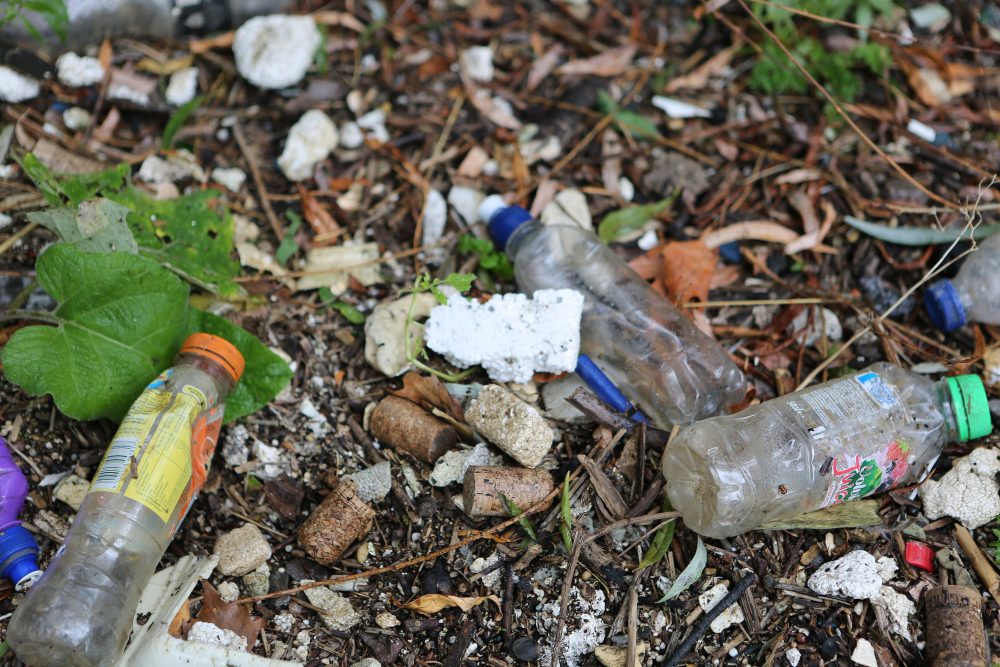
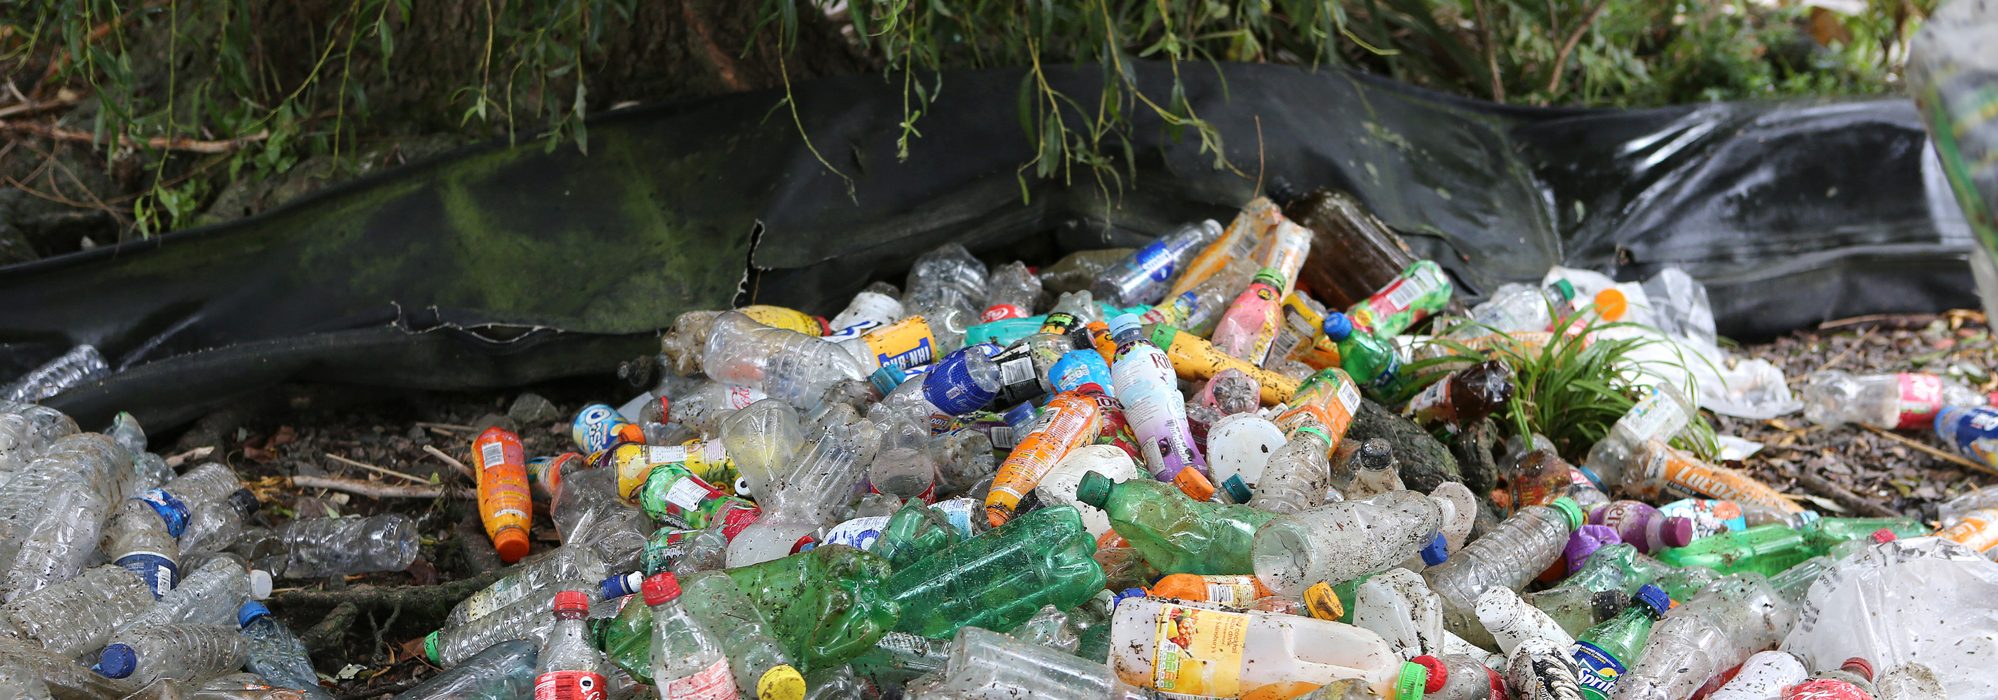
2,500 plastic drinking bottles. That’s the number of single-use plastic drinks bottles collected from the Thames foreshore in one day across 11 London sites.

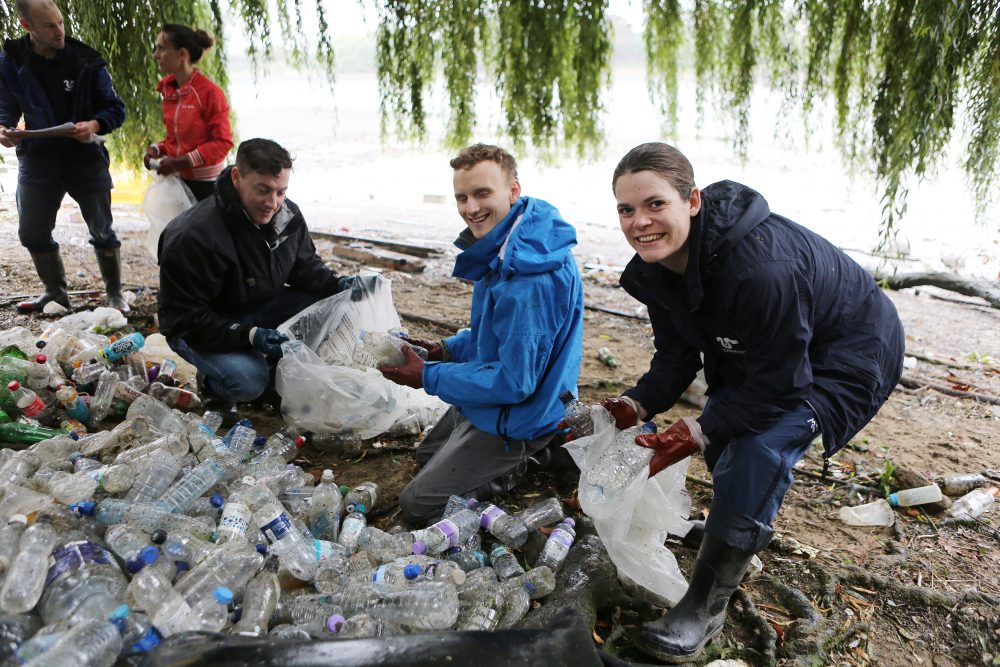
On September the 10th 2016, we co-ordinated our biggest ever simultaneous clean-up event; from Kew Bridge in the west to the Millennium Dome in the east. There were several sites that we weren’t able to get to, so overall we suspect there were more than 3,000 single-use plastic drink bottles on shores around London that day.
We now know the true size of the problem
Thanks to our citizen scientist volunteers, we now have some idea how many plastic bottles litter the Thames foreshore at any one time. Although we often count bottles at sites, up until now we never knew what the state of play was across the whole river. We are looking to repeat the study four times a year which will give us a sense of the variation over the seasons.
Which brands are most commonly found?
In addition, thanks to the work of some incredibly industrious young people at Tidefest on September 11, we managed to identify the brands of 690 bottles that had been picked up the day before. Overall we found there were 92 different brands, the top 15 (or 16%) brands accounted for 67% of the total number of bottles. Curious to know which ones they are? Here they are!
| Brand | Number |
| Coca Cola | 88 |
| Lucozade | 81 |
| Evian | 47 |
| Harrogate | 31 |
| Ribena | 30 |
| Volvic | 26 |
| Sainsbury’s | 24 |
| Volvic (flavoured) | 22 |
| Pepsi | 20 |
| Fanta | 18 |
| Oasis | 18 |
| Buxton | 17 |
| Sprite | 16 |
| Boost | 15 |
| Hayat | 13 |
How regularly do they turn up?
We decided to take the opportunity, having cleared some of the worst hotspots for litter, to monitor them for 8 days subsequently to get a sense of how consistently, and how quickly, new bottles appeared. This revealed some fascinating results, too. The amount of variation in the rate at which bottles accumulate is surprising. At Battersea, for example, we got 10 bottles on the Friday, 117 on the Saturday! What’s going on there then? City of London site Queenhithe Dock (our most reliable site for bottles) got 67 one day; none a few days later! There are clearly some factors going on that need to be unpicked. We plan to look at the wind data for that week to help us begin to do this.

Is it getting worse or better?
Ultimately, however, it’s the long-term trends in which we are interested. We know the number of single use plastic bottles has massively increased over the past decade. Is that trend continuing? Over time, will we see the impact of campaigns like the Cleaner Thames and the #OneLess campaign – which seeks to make London the first city to ban single-use plastic bottles – on the foreshore? Even more difficult, can we estimate the number of bottles that are going through the city every year on their way out to sea?

Help us answer these questions!
Based on the work that our volunteers did in September, we developed a methodology to answer the first question and now have a masters student who has taken it upon himself to undertake it. He’ll be looking at five sites, Crabtree Wharf in Fulham; Putney Slipway, St Mary’s shore in Battersea, Queenhithe in the City of London and the Cutty Sark in Greenwich.
It requires sampling them every two weeks on a neap tide for the next 6 months. If you are interested in being involved in this study, then let us know and we can get you on the team! If we get enough volunteers then we may even be able to expand the number of sites that we monitor, so do get in touch: aj.mcconville@thames21.org.uk
